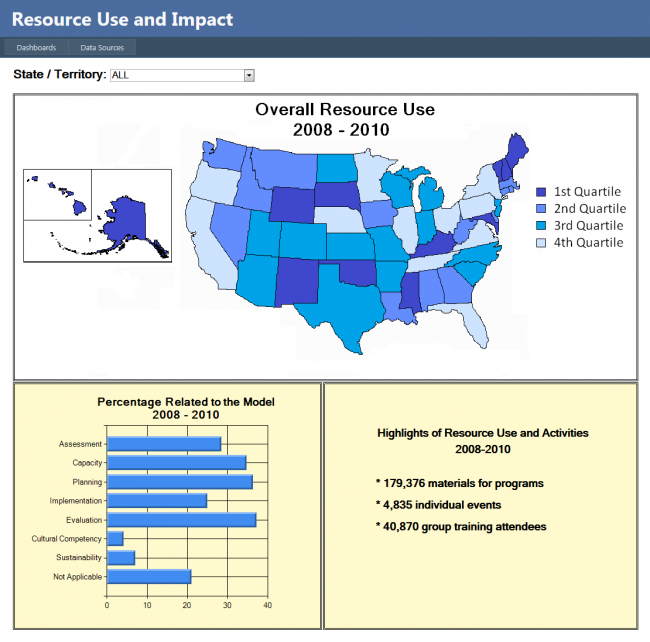
This dashboard uses a simple map overlay and bar charts to display information about resource use and impact. We designed this dashboard to provide interactivity, allowing the user to select a particular state and gather information based on the selection.